Debugging
11 November 2020
Table of Contents
- Introduction
- Opening GDB
- Breakpoints
- Resuming execution
- Examining the stack
- Altering execution
- Checkpoints
- Watchpoints
- Exceptions and crashes
- Summary
- Sources
- Credit and thanks
Introduction
Debugging is the process of finding and fixing bugs in software. It may sound uninteresting but developers and computer scientists often spend just as much time debugging as they do writing code, so getting proficient and comfortable with debugging and the tools for doing it is important.
Debugging techniques fall into two categories. The first and most common is logging.
Logging is a technique that, if you’ve written much code at all, you’re probably already familiar with. It involves littering your code with print statements, running the program over and over again, until eventually you track down your issue.
Logging is tried and tested, and nearly always works.
“The most effective debugging tool is still careful thought, coupled with judiciously placed print statements” — Brian Kernighan, Unix for Beginners.
But when logging isn’t enough, you can turn to debuggers, which will be the subject of this lab.
What is a debugger
A debugger is a program that gives you control over another program that you are trying to test or debug, allowing you to:
- Halt the execution of a program
- Step through a program line by line
- Inspect values of variables at any point
- Alter the execution of a program
As well as many more advanced features.
There is a massive selection of debuggers, and many languages provide their own. However, most debuggers have a similar command line interface. Most languages supported by a Jetbrains IDE have an almost identical GUI within the IDE.
To show you both the command line and the JetBrains interfaces, we are going to cover the command line in the notes and the JetBrains interface in the recorded live session.
For this lab we’re going to be using The GNU Project Debugger (GDB for short). GDB works with a number of languages - C, C++, Pascal, and Rust being some of the most popular. Here we will be using C as it is part of the Bath CS course.
Installing GDB
Due to the privileges debuggers require in order to control another program, installation can be complicated. For Python and Java, debuggers come with the language development kits upon install, which no doubt you will have done already. For C debuggers it’s more complicated. I recommend searching for instructions for your OS and desired debugger. However, CLion (the JetBrains C IDE) will come with one installed already.
Opening GDB
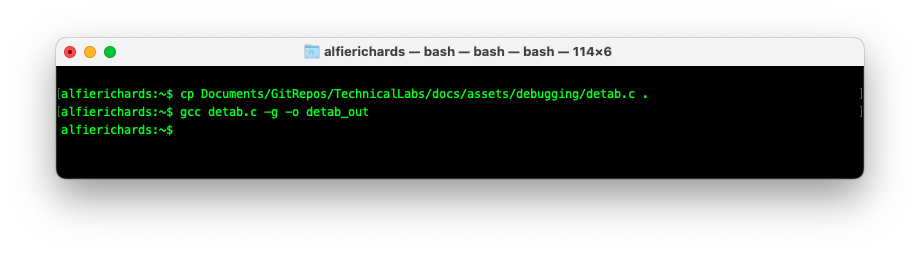
Before you start up GDB you need to compile the C code of your program to be
debugged, and include the symbols table. In brief, the symbols table
correlates commands and addresses in a program’s compiled binary with lines of
source code and the names of variables in the source code. To do this specify
the -g flag in the compiler.
Note: If you compile without the symbols table you will get an error and gdb won’t work correctly.
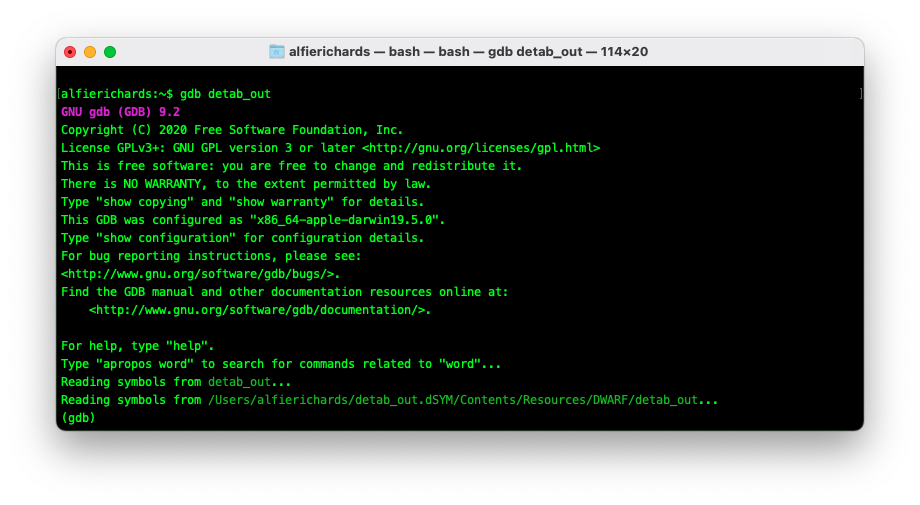
To open a binary with GDB use the command gdb [binary file]. GDB will open and
present a prompt for your commands. The prompt will normally look like (gdb).
In these examples I will be using this C file:
detab.c:
#include <stdio.h>

#define TAB_WIDTH 4

char currentCharacter;

int spacesBeforeChar();
int processLine();

int main() {

   while(processLine() != -1);

   return 0;
}

int processLine() {
    int spacesNum;
    if((spacesNum = spacesBeforeChar()) != -1) {
        int tabs = spacesNum / TAB_WIDTH;
        int spaces = spacesNum % TAB_WIDTH;

        for (int i = 0; i < tabs; i++) printf("\t");

        for (int i = 0; i < spaces; i++) printf(" ");

        do {
            printf("%c", currentCharacter);
            if(currentCharacter == '\n')
                return 0;
        } while ((currentCharacter = getchar()) != EOF);

        // While loop exited, thus EOF recieved
        return -1;


    } else {
        // Reached EOF while reading in spaces
        return  -1;
    }
}

int spacesBeforeChar() {
    int counter = 0;
    while( (currentCharacter = getchar()) != EOF) {
        if(currentCharacter == ' ') {
            counter++;
        } else {
            return counter;
        }
    }
    return -1;
}
This program converts input with spaces for indentation to one that uses tabs. I wrote it a long time ago while learning C. As a result it’s not very well written, but it will work as an example here.
You can download the file here if you wish to play with it yourself.
run command
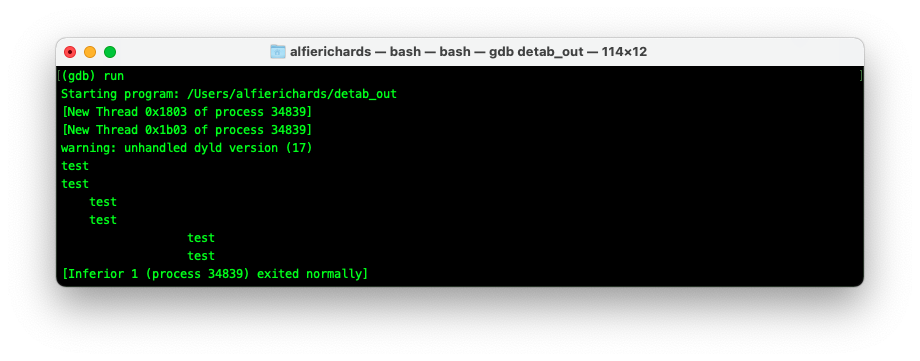
After loading a binary into GDB the run [arguments] command (or r
[arguments]) runs the program.
Breakpoints
To get GDB to halt at a certain line you need to insert a breakpoint. A breakpoint tells GDB to stop whenever it reaches a certain line. Once GDB has halted, you can enter commands to inspect or alter the program.
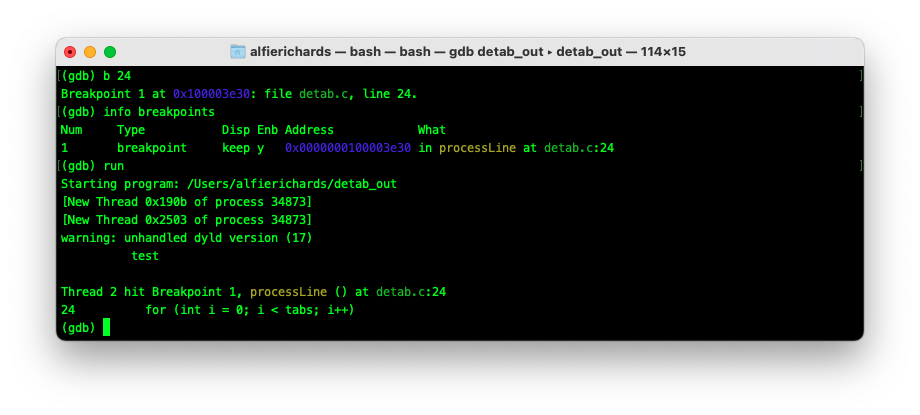
To insert a breakpoint use the command break [line number]
(or b [linenumber]).
GDB will then print the name of the new breakpoint you’ve created. You can look
at the list of current break points with info breakpoints.
You can also enable and disable the breakpoint with enable [breakpoint number]
and disable [breakpoint number] respectively.
When you call run and the program gets to this line it will halt and the GDB
prompt will open up to let you know it has hit the breakpoint.
You can look at the code around the breakpoint with the list command (or l),
which lists 11 lines of code centred on the current line.
Resuming execution
Once in a breakpoint you may want to continue execution of the program. You have a few ways to do this:
The continue (or c) command will resume execution until the next breakpoint
is hit.
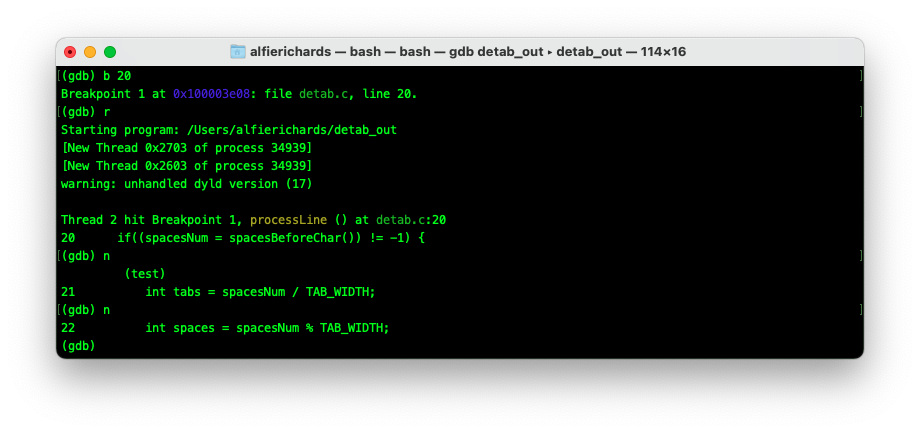
The next command (or n) will run until the line below the current line runs
in the code. Often called step over.
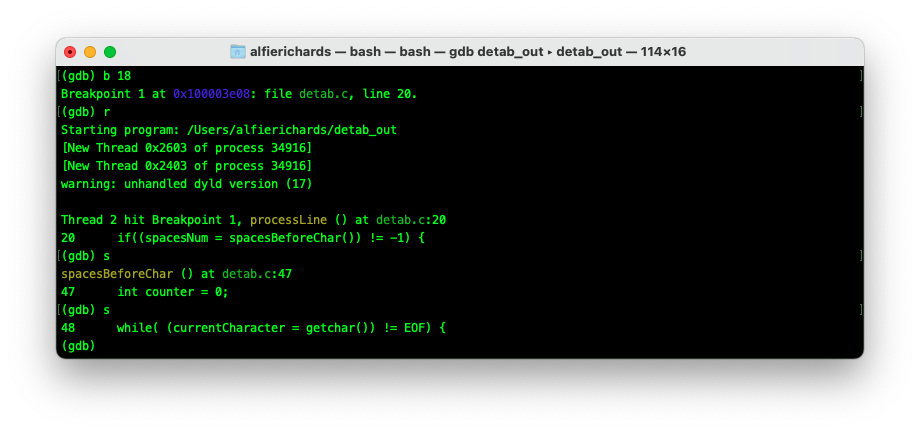
The step command (or s) will run until the next line of code is reached. If
the current line contains a function, this will then stop on the first line of
that function. That is why this is often called step into as it will go into
functions.
The finish (or f) command will run until the end of the current function,
then will break and print the result.
The until [line number] command will run until execution reaches a certain
line.
Examining the stack
In C (and most programming languages) each time you perform a function call, information about the call is stored. This includes the location of the call, the arguments of the call, and the local variables of the function being called. This data is stored in a block called a stack frame. Stack frames together make up the stack.
bt (backtrace) command
After you’ve halted in GDB you probably want to know where you are and how you
got there. When you reach a breakpoint GDB will automatically select the
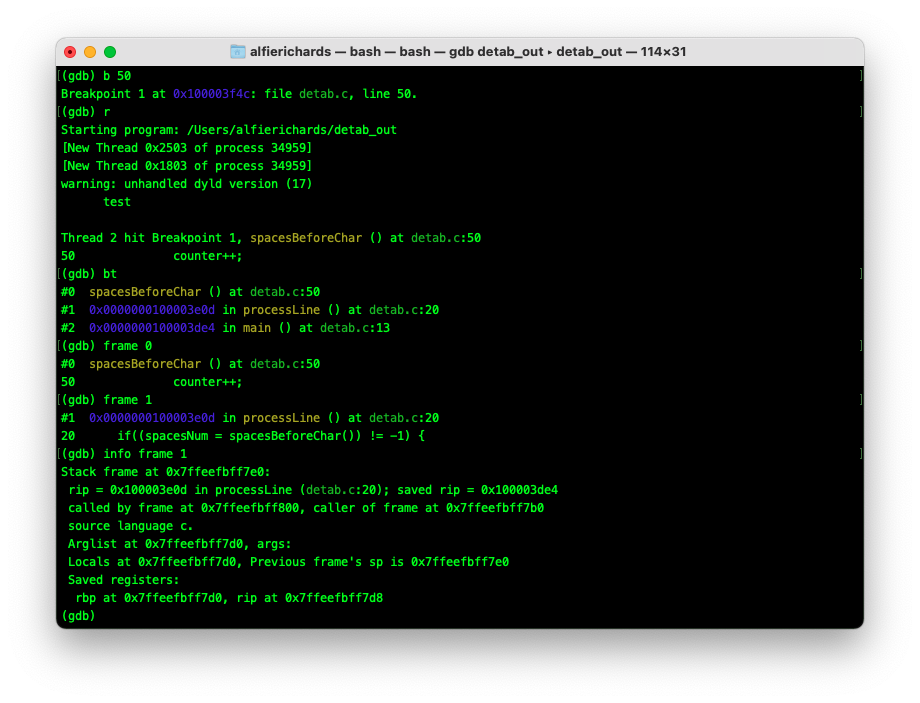
executing stack frame. The backtrace command (or bt) will then print all the
stack frames up until the main stack frame.
You can specify a -[number] flag to only print number stack frames.
The frame command
With the frame [frame number] command you can then select any frame you want.
Or use up to go up one frame and down to go down one.
Printing the contents of a frame
The frame command with no parameters prints a description of the frame.
info frame prints a more verbose description.
Finding variable values
You can also inspect the contents of variables at any point with print
[variable].
Altering execution
You can now run through a program in a controlled way. However, you may want to change the course of execution. There are a couple of ways to alter the path of execution in your program.
j(ump) command
The first way is with the jump [line number] command (or j), which will jump
to another line and resume execution there.
return command
With the command return [value], GDB will return from the current function
with value.
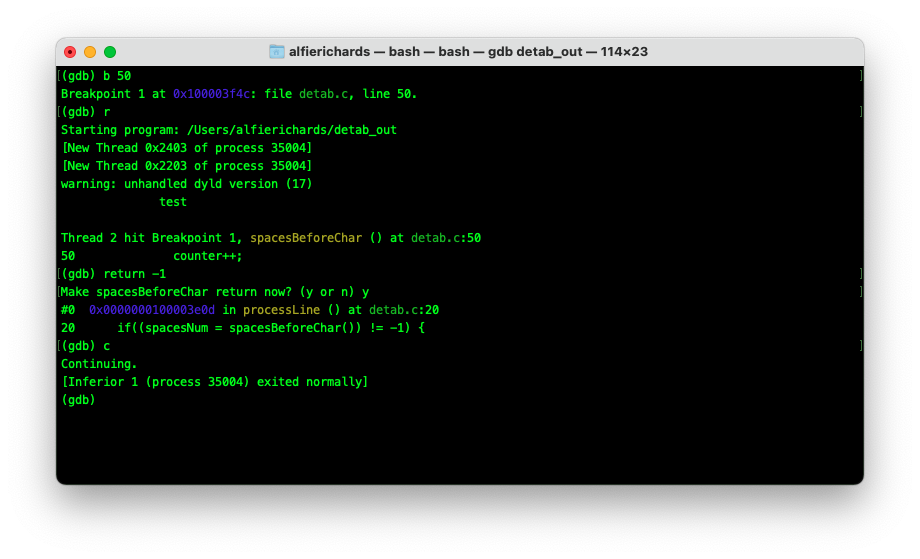
Here you can see I returned -1 from the function, indicating that the function
recieved an EOF character, resulting in the program exiting early.
Assigning values to variables
You can alter execution by assigning different values to functions. To do this
use the command call [expr] where the expression is an assignment to a
variable. For instance, you could use the command call foo=2 to set foo to
2.
Checkpoints
A more advanced feature that not all debuggers have is the ability to use checkpoints. The concept of checkpoints may be familiar from video games. Essentially, you can save the state of the program and can then later return to that state at any point to re-run something. In this way if you have a specific part of the program you wish to debug, you can save a checkpoint before it occurs, try something - if it fails return to the checkpoint, change some state, and try again.
To save a checkpoint use the command checkpoint. You can see a list of
checkpoints with info checkpoint and restore to a checkpoint with restart
[checkpoint number].
Watchpoints
Another more advanced feature some debuggers support is the concept of watchpoints. Watchpoints are similar to breakpoints but instead of breaking whenever a execution reaches a line of code, a watchpoint breaks every time a variable is changed.
To set a watchpoint use the command watch [variable]. Watchpoints can be
enabled, disabled and deleted in the same way as breakpoints.
Exceptions and crashes
One of the main uses of GDB and other C debuggers more generally is to allow a
little more insight into C’s errors and crashes. If your program receives a
signal when running in GDB (for example, a SIGSEGV, or segmentation fault
signal), the program will halt execution allowing you to examine where execution
is at the point which your program is erroring.
Summary
Hopefully, you’ve seen some features of GDB that would have been useful in your debugging, or that you could imagine being useful in future debugging. On top of that, GDB has a massive number of features we couldn’t cover here. I want to emphasise that while this lab used GDB, most languages have a variety of debuggers that work with them, and they will have a similar feature set - normally with a similar interface and commands.
Additionally, in the video for this week I have gone through the same feature set using the Jetbrains GUI in CLion, which may be easier if this is your first experience debugging.
Sources
The bulk of the research for this lab was from the GDB manual which is open source and can be found here.
There will be good tutorials and introductions to any compiler you wish to learn online. You will also learn a lot from use.
Credit and thanks
Written by Alfie Richards
Edited by Joe Cryer
Additional help from:
- Søren Mortensen
- Dr Russell Bradford